Fotomics
The Fotomics method transforms tabular data into synthetic images using the Fourier Transform. It computes the Fourier Transform of the input set, averages the real and imaginary values across samples to determine feature coordinates, and maps them to a 2D grid. This implementation extends the original method by introducing multiple techniques for mapping features to pixels, optimization algorithms for handling feature collisions, and flexible pixel value aggregation strategies including relevance-weighted calculations.
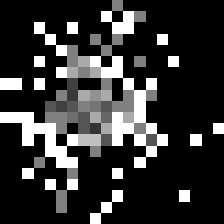
Import Fotomics
To import Fotomics model use:
>>> from TINTOlib.fotomics import Fotomics
>>> model = Fotomics(image_dim=30)
Inherited base functionality
Fotomics inherits from ParamImageMethod (see Base classes), so it also provides:
Feature coordinates: a feature-to-pixel mapping exported to
features_positions.csvafterfit/fit_transform.Programmatic access:
_get_features_mapping()returns the feature coordinates as a DataFrame once the model is fitted.Shared utilities:
saveHyperparameters/loadHyperparametersand the standardfit/transform/fit_transformworkflow.
Hyperparameters & Configuration
When creating the Fotomics class, some parameters can be modified. The parameters are:
Parameters |
Description |
Default value |
Valid values |
|---|---|---|---|
|
Order size for a square matrix image. |
Required |
integer |
|
The type of problem, defining how the images are grouped. |
‘classification’ |
[‘classification’, ‘unsupervised’, ‘regression’] |
|
Preprocessing transformations like scaling, normalization, etc. |
LogScaler() |
Scikit Learn transformers or custom implementation inheriting CustomTransformer. |
|
Show execution details in the terminal. |
False |
[True, False] |
|
Treat outliers after Fourier transform. |
True |
[True, False] |
|
Minimum percentile for outlier detection. |
10 |
integer |
|
Maximum percentile for outlier detection. |
90 |
integer |
|
Technique to treat outliers. |
‘zero’ |
[‘zero’, ‘max_min’, ‘avg’] |
|
Technique to map features to pixels. |
‘bin_digitize’ |
str (e.g., ‘bin_digitize’) |
|
Relocate features so that each pixel can represent a single feature. |
False |
[True, False] |
|
Optimization algorithm applied in the pixel assignment stage. |
‘linear_sum’ |
str (e.g., ‘linear_sum’) |
|
Technique to calculate pixel values sharing multiple features. |
‘avg’ |
str (e.g., ‘avg’) |
|
Multiplication factor determining the size of the saved image relative to the original size. |
1 |
integer > 0 |
|
Output format using images with matplotlib with [0,255] range for pixel or using npy format. |
‘png’ |
[‘png’, ‘npy’] |
|
Color map to use with matplotlib. |
‘gray’ |
‘viridis’, ‘plasma’, ‘inferno’, ‘magma’, ‘cividis’, ‘Greys’, etc. |
|
Seed for reproducibility. |
1 |
integer |
Code example:
>>> model = Fotomics(image_dim=30, outliers=False, zoom=2)
All the parameters that aren’t specifically set will have their default values.
Functions
Fotomics has the following functions:
Function |
Description |
Output |
|---|---|---|
|
Allows to save the defined parameters. |
.pkl file with the configuration |
|
Load Fotomics configuration previously saved with
|
|
|
Trains the model on the tabular data. This step computes the Fourier Transform and determines feature coordinates.
|
|
|
Generates and saves synthetic images in a specified folder. Requires the model to be fitted first.
|
Folders with synthetic images |
|
Combines the training and image generation steps. Fits the model to the data and generates synthetic images in one step.
|
Folders with synthetic images |
The model must be fitted before using the transform method. If the model isn’t fitted, a RuntimeError will be raised.
Citation
Paper: https://doi.org/10.1007/s10462-022-10357-4
Code Repository: https://github.com/VafaeeLab/Fotomics-Imagification