Introduction
This documentation provides detailed instructions on how to install, configure, and use TINTOlib—a Python library designed to transform tabular data into synthetic images, enabling the application of advanced vision-based machine learning models on traditional data sets.
Installation
To use TINTOlib, first install it using PyPi:
(.venv) $ pip install TINTOlib
For more details, visit: TINTOlib on PyPI <https://pypi.org/project/TINTOlib>
Additional Resources
TINTOlib Crash Course Hands-on notebooks and slides showing how to use CNNs, ViTs, and Hybrid Neural Networks (HyNNs) with TINTOlib.
TINTOlib GitHub Repository Main codebase with transformation methods, examples, and full documentation.
Importing Methods
TINTOlib offers a variety of state-of-the-art methods for constructing synthetic images from tabular data. To use these methods, import the required models as shown below:
>>> from TINTOlib.tinto import TINTO
>>> from TINTOlib.igtd import IGTD
All the methods requires the same input format and the responses outputs will have the same format.
Available Methods
Models |
Class |
Hyperparameters |
|---|---|---|
|
problem, transformer, verbose, pixels, algorithm, blur, submatrix, amplification, distance, steps, option, times, train_m, zoom, format, cmap, random_seed |
|
|
problem, transformer, verbose, scale, fea_dist_method, image_dist_method, error, max_step, val_step, switch_t, min_gain, zoom, format, cmap, random_seed |
|
|
problem, transformer, verbose, hcIterations, n_processors, zoom, format, cmap, random_seed |
|
|
problem, transformer, verbose, pixel_width, gap, zoom |
|
|
problem, transformer, verbose, zoom |
|
|
problem, transformer, verbose, zoom |
|
|
problem, transformer, verbose, pixels, feature_importance, font_size, random_seed |
|
|
problem, transformer, verbose, size, bins, zoom |
|
|
problem, transformer, verbose, precision, zoom |
|
|
image_dim, problem, transformer, verbose, outliers, min_percentile, max_percentile, outliers_treatment, assignment_method, relocate, algorithm_opt, group_method, zoom, format, cmap, random_seed |
|
|
image_dim, problem, transformer, verbose, algorithm_rd, assignment_method, relocate, algorithm_opt, group_method, zoom, format, cmap, random_seed |
Input Format
TINTOlib supports two primary data input formats:
Pandas DataFrame
Use a Pandas DataFrame with the target variable in the last column and features in other columns, all in numerical format.
Follow the Tidy Data principles.
CSV Files
Format your CSV with commas as separators and the target variable in the last column.
Ensure the first row contains feature names and all data is numerical.
Example Usage:
model = TINTO()
model.fit_transform('path_to_csv_file', 'result_folder_path')
Generating Synthetic Images
To generate synthetic images, TINTOlib provides fit, transform, and fit_transform methods:
Fitting the Model: The fit method trains the model on the tabular data:
model.fit(data)
Generating Synthetic Images: After fitting, use transform to generate and save images:
model.transform(data, folder)
Combining Fit and Transform: The fit_transform method combines training and image generation:
model.fit_transform(data, folder)
Parameters for Methods: - data: A path to a CSV file or a Pandas DataFrame containing the features and targets. - folder: Path where the synthetic images will be saved.
Output Format
The output of the model.transform(data,folder)() and model.fit_transform(data,folder)() method are synthetic images grouped in folders depending on their class value.
For example:
If the dataset is composed of 3 different classes, the method will create 3 folders and each folder will contain one synthetic image for each instance with that class.
—
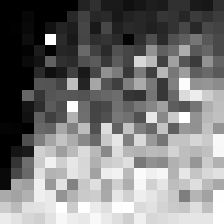
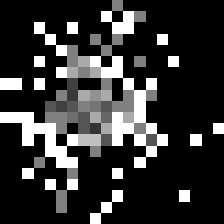
Example Generated Synthetic Images using TINTOlib
This section provides visual examples of synthetic images generated by different methods in TINTOlib.
TINTO Method

IGTD Method

REFINED Method

BarGraph Method

DistanceMatrix Method

Combination Method

SuperTML Method

FeatureWrap Method

BIE Method

Fotomics Method
DeepInsight Method